Trick Service DRAW 2.0.8 – General overview
The Trick Service DRAW (Dependencies for a Risk Analysis on a WhiteBoard) user guide introduces the user to all functionalities of the application.
The DRAW tool is open source by itrust consulting and is used to represent assets and their corresponding dependencies in a graphical manner. The assets are represented as nodes in the graph and the dependency is represented using an edge from one asset to another. The asset carries information of the name of the asset and its type example the asset may be a Financial, Business process etc. The edge carries the dependency information and also the probability information. Probability implies the chances that an asset impacts the other asset.
As an example if there is an edge between Server to Server Data it implies that a problem at Server might cause a problem with Server Data. Furthermore this tool can also be synchronised with Risk Analysis Tool (TrickService) tool to synchronize asset names, asset types etc.
After connecting to the TRICK Service DRAW URL (https://draw.trickservice.com), the user sees the home screen with the interface that looks as:

Given the Home screen the user has the possibility to carry out a set of operations.
- Each of these operations are explained in sub-sections.
- Create a dependency graph (see [Section])
- Edit the dependency graph (see [Section])
- Save the existing dependency graph (see [Section])
- Open an existing dependency graph (see [Section])
- Align the dependency graph (see [Section])
- Import dependency graph (see [Section])
- Coordinate with Trick service (see [Section])
- What's New? (see [Section])
Create a dependency graph
In order to create a dependency graph the user needs to add assets by specifying the name and the type of asset. Further the user needs to add edges between the nodes of the graph.
Add Assets
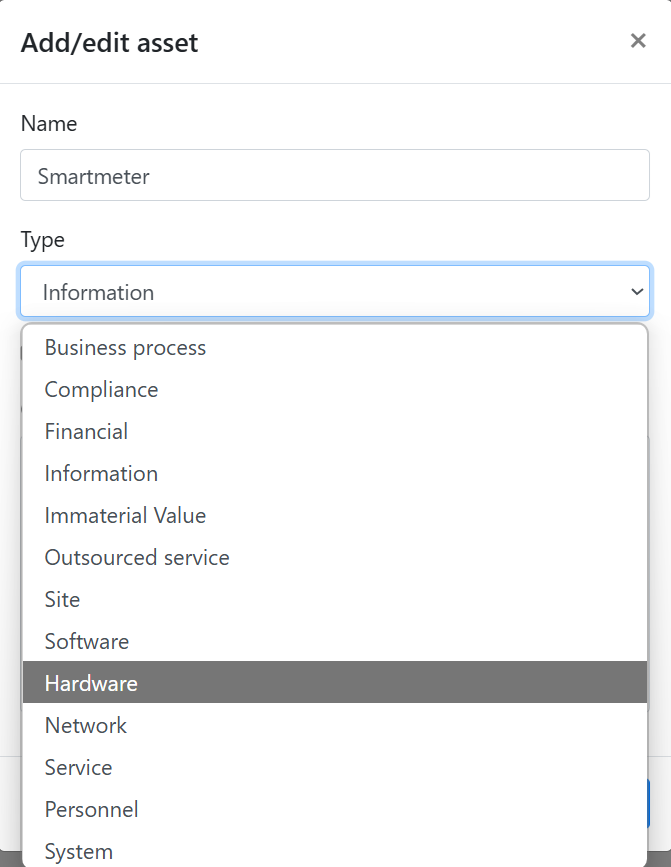
In order to add an asset click on the Add asset icon in the main menu. Specify the Name and Type information [Figure].
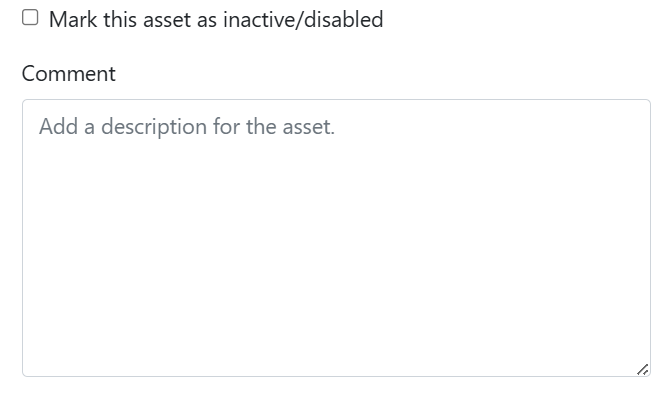
If needed: mark asset as inactive or add a comment [Figure].
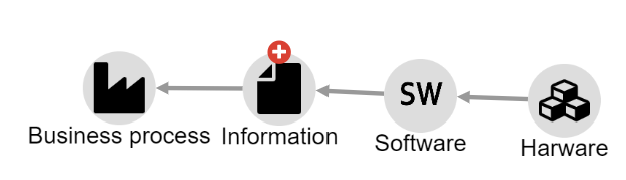
Set Dependency Between Two assets
In order to set dependency between two assets, select the source asset, hold the mouse when an edge appears and then drop it on to the dependent asset. This creates an edge from source asset to the dependent asset. Edges are typically directed from Right to Left. ie. from supporting assets to the primary assets. The default impact Probability is assumed to be 1 between two assets which are connected by an edge. However this probability can be modified by clicking on the edge and specifying probability other than 1 (acceptable values between 0-1).
Edit the dependency graph
Once the dependency graph is created it can be modified in following ways:
- Modify the name and type of asset: Double click on the asset node to open the edit interface.
- Modify the probability of the edge: Double click on the edge to modify the probability.
- Add or delete a new asset: Select the asset(s) and use DEL key.
- Add or delete an existing edge: Select the edge(s) and press DEL key.
Save the existing dependency graph
Once the dependency graph is created it can be saved using the Save main menu option. The graph can be saved in three formats. (see [Section] for more details)
- JSON format:By default the graph is saved in a json format. The default file name of the file is graph.jsonThis can be achieved by clicking on Save main menu option
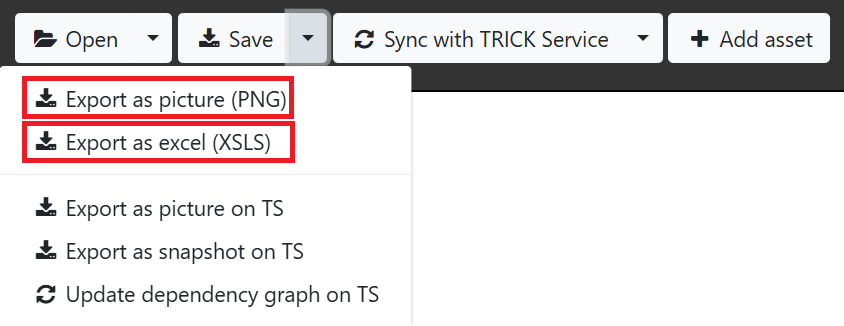
- PNG format:The graph can be saved/exported in PNG format by selecting Export as picture(PNG) from the drop down menu on right of Save main menu option.
- EXCEL format:The graph can be saved/exported in EXCEL format by selecting Export as excel(XSLS) from the drop down menu on right of Save main menu option. The saved excel file shall contain a sheet called Dependency. The matrix in this sheet represents an edge between source and target assets. If the matrix with edge contains a number this number shall represent probability of impact.
Open an existing dependency graph
A dependency graph once saved as json/excel file can be opened using the Open main menu option for viewing or further editing. The supported filename extensions are .json,.xlsx,.xls,.xlsm.
Align the dependency graph
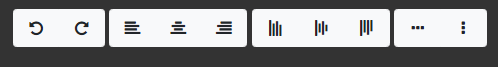
The dependency graph can be aligned using the alignment tools represented in [Figure].
Import an existing dependency graph
A dependency graph can also be imported from an excel sheet into the DRAW Whiteboard. During the import the existing DRAW graph on the whiteboard is not cleared but updated with the additional assets and dependencies from the imported dependency sheet. The specification of such an excel sheet representing the asset dependency is as below:
- The excel sheet shall have a worksheet named Dependency
- The Dependency sheet shall represent the Dependency Matrix of all the assets.
- There shall be two mandatory column headers AssetList, AssetType and three optional AssetComment, AssetPositionX, AssetPositionY. The AssetList header shall be in any cell in the first column of the sheet. The AssetType column shall represent the assetType of the asset on its left. The optional AssetComment column shall represent the description of an asset and can be abscent. The optional AssetPositionX and AssetPositionY columns shall represent assets' position on the DRAW WhiteBoard and can be abscent.
- The AssetType shall be a valid supported assetType. Refer [Figure] below.
- Any row(s) above the column names AssetList shall be ignored.
- AssetList shall be present in the first column in any row.
- The column AssetList shall contain all the valid assets (representing Source Assets)
- A subset of valid assets in columns' header shall represent Target Assets.
- An intersection of row Source Asset -> column Target Asset shall be a real number (between 0 and 1 both inclusive) representing the dependency from Source Asset to Target Asset. This number shall represent probability of impact.
- If the intersection contains 0 or no value it shall imply that Source Asset is not dependent on the corresponding Target Asset.
- In order to map graph assets with Source assets in Dependency sheet both asset names and their corresponding asset types shall be considered.
- In case the graph already contains an edge between a source asset and a target asset then following rules shall apply:
- If the intersection of source asset with target asset in the matrix contains a value 0 or unspecified then the edge in the graph between the source and target asset shall be removed
- If the intersection of source asset with target asset in the Dependency sheet contains a value which is different from the existing probability of edge between source and target then the probability shall be updated with the new probability from the Dependency sheet
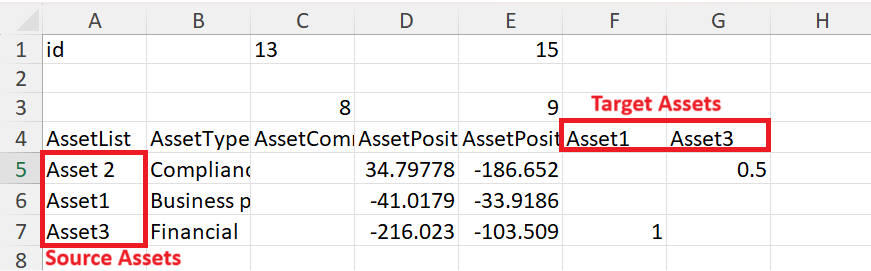
- Refer Example below:
- The DRAW graph shall be created using 3 assets
- Asset1 with Type as Business process
- Asset2 with Type as Compliance
- Asset3 with Type as Financial
- The column (AssetNE) shall be ignored for asset mapping since it is not present in the AssetList Column
- The rows 1, 2, 3 shall be ignored.
- There shall be two dependencies in the Graph.
- Asset2 depends on Asset3 with probability (0.5)
- Asset3 depends on Asset1 with probability (1)
- The DRAW graph shall be created using 3 assets
- In case of any error an error dialog box is opened redirecting the user of appropriate corrective measure.

NOTE: Template of a sample excel file can be downloaded here.
Supported formats of exported file
DRAW supports three file formats JSON, PNG and EXCEL to represent and save the asset dependency.

JSON:
The default supported format for loading and saving DRAW graph is JSON. The graph can be saved in JSON format by clicking Save option from main menu. Refer [Figure] The JSON file contains nodes and edges. The nodes contains the list of nodes in the graph. Each node carries following information:
- id: Representing graph identifier
- name: Representing asset name
- type: Representing the asset type
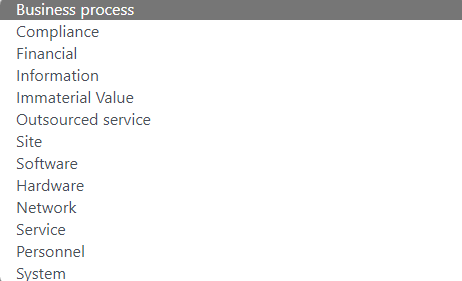
Following is the list of supported asset types:- Business process
- Compliance
- Financial
- Information
- Immaterial Value
- Outsourced service
- Site
- Software
- Hardware
- Network
- Service
- Personnel
- System
- disabled: True if asset is inactive/disabled
- trickId: Representing trickId of the asset. The trickId is a risk assessment identifier in Trick Service application
- position: Representing asset position in whiteboard. Position specifies x, y coordinates of the model position of center of asset node. This position remains same with zoom and pan of the asset node.
- source: The id of the source asset
- target: The id of the target asset
- p: The probability of impact of source on target. This is a value between 0 and 1. Default probability between connected source and target asset is 1.
PNG:
The DRAW graph can also be saved in PNG format. This can be done by clicking on Export as picture(PNG) option from dropdown menu right of save menu.
Excel:
The DRAW graph can also be saved in Excel format. This can be done by clicking on Export as excel(XSLS) option from dropdown menu right of save menu.
The exported excel contains the following features:
- The name of exported file is "AssetDSInExcel.xsls".
-
The exported excel file has two sheets:
- Dependency which contains the asset dependencies. The Dependencies sheet represents the DRAW graph in the same format as that used during the Import from Excel (see [Section]);
- Parameters which contains the list of valid supported assets (see [Figure]);
Coordinate with Trick service
Sync with TRICK service
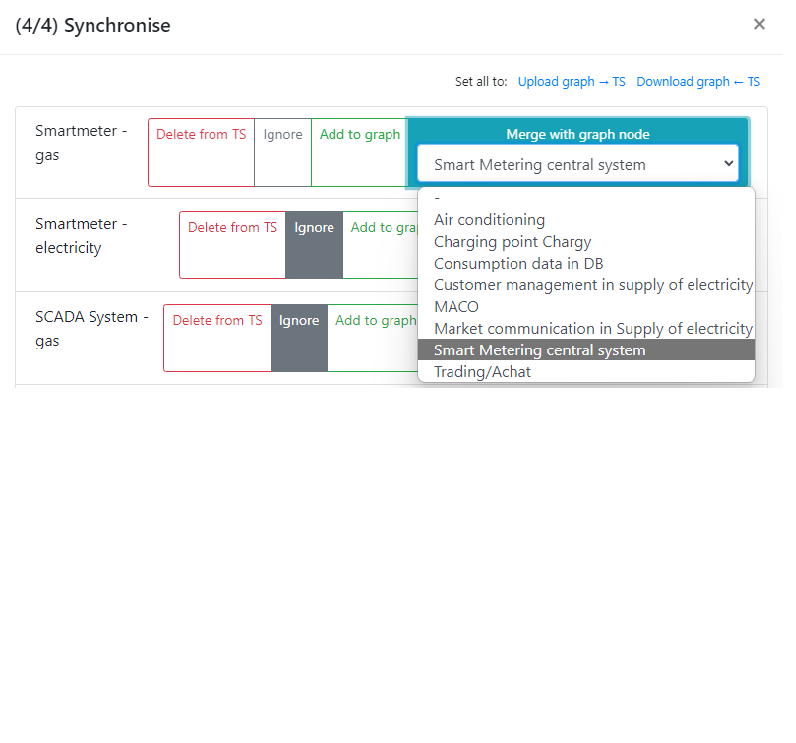
The dependency graph can be synchronised with Trick Service Risk Analysis tool proprietary to itrust consulting. The Synchronize with Trick Service main menu option provides this synchronization capability. Upon clicking this option the user needs to choose the TrickService platform, customer , risk analysis and version number present in Risk analysis portfolio in Trick Service. If there is any inconsistency between the current dependency graph assets and the Trick Service Assets in the selected Risk Analysis profile then the Synchronise dialog box appears and provides user options to synchronize the the assets. There are three possibilities:
- Asset exists in TS and not in DRAW:
- Asset exists in DRAW and not in TS:
- Asset exists in both DRAW and TS but the asset Types or active/inactive values are not same:
- User can update the values in either Trick Service or in dependency graph. [Figure]


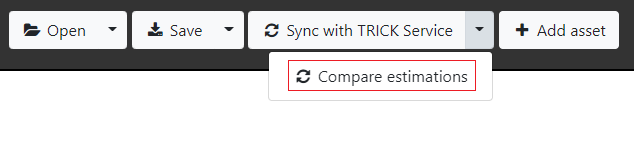
Compare estimations with Trick Service [Beta Version]
The compare estimation feature allows the user to model and simultaneously compare the propagation of risk as defined by Trick Service. In Trick Service the different risk scenarios are applied to all assets, and for each Scenario-Asset combination there is a likelihood (expected value of occurence per year, called probability per year) and an impact (k€). However each risk scenario tends to impact several assets, and it is often difficult to consider when assessing the scenario on an asset, whether or not the cumulative or indirect impact on the given asset has been considered or not. Hence in Trick Service risks are considered independent. However in DRAW we can model the propagation of risk using the asset dependency relationship where each edge between two assets carries the information of propagation rate called as probability.
The Compare estimations compares the Impact/Likelihood based on DRAW propagation rates and generates a report.csv and report.html file at the end of comparison. The user may use the generated report to revise the estimates/impacts in Trick Service to add more precision based on asset dependency. The estimation report(s) contains tabulated report for each asset/scenario combination. The columns of these reports are described below:
- Asset: This field represents the asset name.
- Scenario: This field represents the corresponding scenario for the given asset.
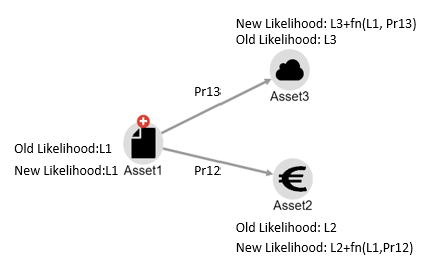
- Old Likelihood: This field represents the Likelihood for asset/scenario combination as fetched from Trick Service assessment.
- New Likelihood: This field represents the Likelihood for asset/scenario combination as computed by DRAW. This takes into account the probability of the edge from one asset to another (propagation probability) along with impact values fetched from Trick Service for the asset/sceanrio combination. The new Likelihood is the sum total of likelihood of damage starting somewhere else and propagating at the given asset and contributing to damage done to the given asset. The algorithm to determine new Likelihood is a complex algorithm which determines the new Likelihood as a function of old likelihood and the probability of propagation. This can be visualized in the Figure (see [Figure]); Note that however a dependency graph might be large and full of cycles, so that a deterministic calculation takes enormous time. That is why DRAW implements a probabilistic algorithm (which simulates about 1 million situations, in which propagation decisions are randomly taken, and averages the overall result. This also explains rounding errors which in any case are less important than the uncertainty of the estimated parameters.
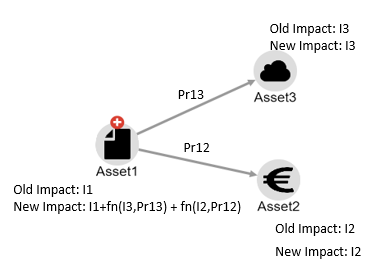
- Old IMPACT: This field represents the Impact for asset/scenario combination as fetched from Trick Service assessment.
- New Impact: This field represents the computed impact for asset/scenario combination as computed by DRAW. The new impact is computed based on the impacts on all assets that might be damaged as a consequence of damage starting at the given asset. The algorithm to determine new impact is a complex algorithm which determines the new impact as a function of old impact and the probability of propagation of impacted assets. This can be visualized in the Figure (see [Figure]); Note that however a dependency graph might be large and full of cycles, so that a deterministic calculation takes enormous time. That is why DRAW implements a probabilistic algorithm (which simulates about 1 million situations, in which propagation decisions are randomly taken, and averages the overall result. This also explains rounding errors which in any case are less important than the uncertainty of the estimated parameters.
- Impact on scales(s): This field represents the impact on various scales such as Financial/Privacy/Operational/Moral/Physical/Legal/Reputational/Affected Deliveries/Peronnel. The impact scales which are included in Trick Service assessment settings are included as different columns in the report.
- New Impact assessment(s): This field represents the computed Impact on corresponding scale as specified in Trick Service.
Compare estimations with Trick Service [Example]
-
Illustrating below using a small example of comparing estimations using DRAW:
- Create an asset dependency graph in DRAW and assign propagation probability to the edges
- In Trick Service estimate the direct impact on assets and direct likelihood of the scenarios
- Sync asset dependency graph in DRAW with Trick Service assessment
- Compare estimations of Trick Service with DRAW
- Revise the estimations in Trick Service using the report generated by DRAW
- The section below describes in detail each step summarised above:
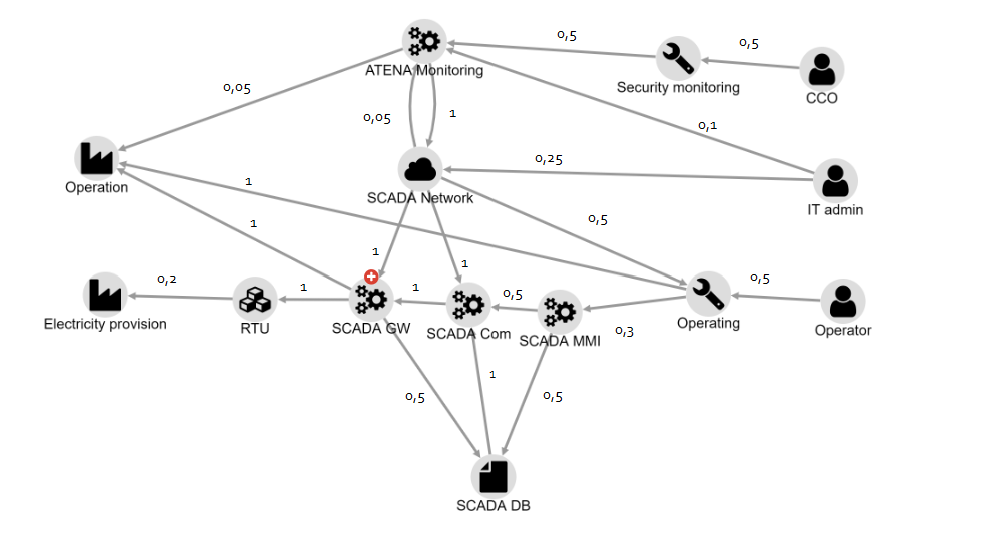
- Create an asset dependency graph in DRAW and assign propagation probability to the edges
Consider an asset dependency graph created in DRAW (see [Figure]) as below. This graph can be understood as follows. The asset Chief Cybersecurity Officer (CCO), if he is attacked has 50% probability to destroy the integrity of the Security monitoring service, and this has 50% chance to destroy the integrity of ATENA monitoring. Similarly a manipulated RTU has 20% chance to manipulate electricity provision (creating an outage). Note that the propagation probability is currently present only in JSON export file. These are hence added manually to edges of the graph in figure below.
TRICK Service DRAW compare estimations (Asset Dependency) - In Trick Service estimate the direct impact on assets and direct likelihood of the scenarios
Provide estimate of assets and likelihood of impact as in table below. Note that only a single scenario is provided here for brevity, however the same may be provided for multiple
asset/scenario combinations:
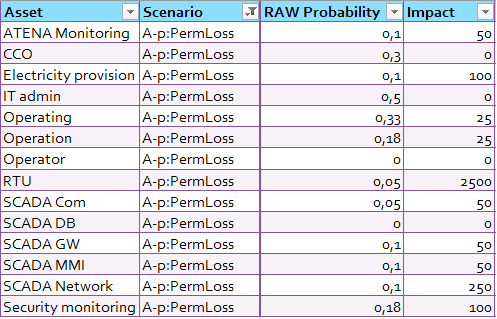
TRICK Service DRAW compare estimations (Risk Estimation in Trick Service - truncated for conciseness) - Sync asset dependency graph in DRAW with Trick Service assessment Synchronize the asset dependency graph with Trick Service assessment (see [Section])
- Compare estimations of Trick Service with DRAW Click on Compare Estimations from Sync with Trick Service menu. This will analyse the data and prepare to generate report. Once this is done click on Export button to export report.html and report.csv files. Note you might have to provide permissions in browser to download multiple files at once.
- Revise the estimations in Trick Service using the report generated by DRAW
The generated report(s) contains the old and revised estimates of likelihood, impact, financial corresponding to all combinations of assets and scenarios.
These new estimations can further be revised on Trick Service.
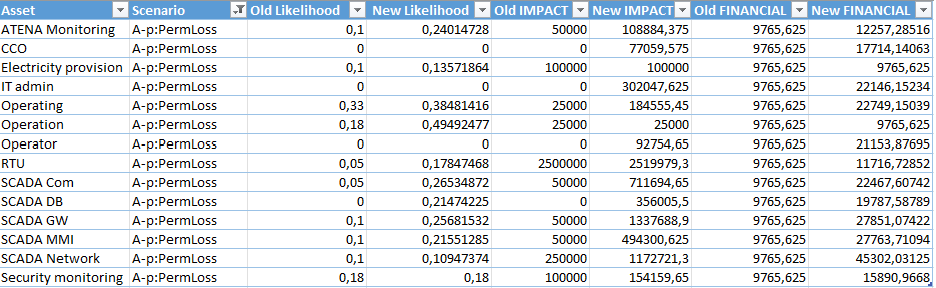
TRICK Service DRAW compare estimations (Generated CSV report - truncated for conciseness)
Export to TRICK service
The user has an option to save the dependency graph to TrickService. This can be done in three ways:
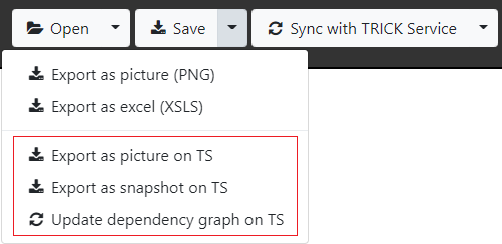
- Export as picture on TS: The user can export the current dependency graph in PNG format to TrickService Risk Analysis. This picture can be used in TS Word Report generated using a template which has a bookmark called TS_DependencyGraph. Before using this option the user must ensure that the graph fits in the current DRAW WhiteBoard else the picture may appear truncated.
- Export as snapshot on TS: The dependency graph can also be exported to Trick Service as a snapshot. This snapshot can be later loaded from Trick Service risk analysis profile. Trick Service will save this data but will not interact with it which implies that the connections in this graph are not used to update the Trick Service asset dependency
- Update dependency graph on TS: The dependency graph on Trick Service can be saved using this option. This option will update the asset dependency graph on Trick Service. By default the asset dependency graph in Trick Service risk analysis comprises of all the assets as unconnected nodes. This option will update the dependency graph on trick service using the connected nodes in DRAW white board which have been synchronized with Trick Service earlier. All unconnected asset nodes which are not synchronized with DRAW previously are ignored. However if a connected asset node is found in DRAW which has not been synchronized with Trick Service earlier (Implies that asset is not present in Trick Service already) will result in an error.
Load from TRICK service
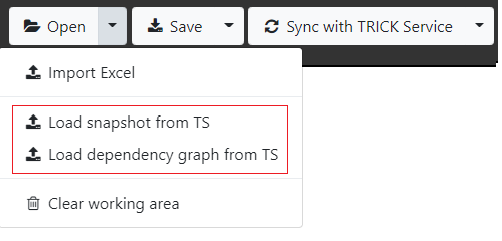
The user has an option to load the dependency graph from TrickService. This can be done in two ways:
- Load snapshot from TS: Using this option the user can also load the snapshot from Trick Service which was saved using Export as snapshot on TS option.
- Load dependency graph from TS: Using this option the user can load the dependency graph from Trick Service which was earlier saved using Update dependency graph on TS option.
What's new?
Release 2.0.8
- Fixed vulnerabilities due to outdated lodash library.
- Fixed vulnerabilities due to outdated bootstrap library.
Release 2.0.7
- Added position columns in excel sheets of graphs exported as excel file
Added two columns AssetPositionX and AssetPositionY in the excel sheet of the graph exported as excel file. These columns represent the position of the asset node in the DRAW whiteboard. The position of the asset node is represented by two columns AssetPositionX and AssetPositionY in the excel sheet. These columns are optional and can be absent. If these columns are absent then the asset nodes are placed at default position on the whiteboard. Note that this feature is only available for excel files created on version 2.0.7 or higher. (see [Figure]) - Added ability to arrange all columns except AssetList in excel sheets in any order
The order of the columns in the excel sheet is not important. The AssetList column is mandatory to be placed in first column , the other mandatory column is AssetType which can be in any column positionAssetList. All other columns can be present in any order. The order of the columns in the excel sheet does not affect the import process. Note that this feature is only available on DRAW version 2.0.7 or higher.
Release 2.0.6
- Added comment fields in assets (see [Figure]).
- Added alphabetical sorting of asset names in excel sheets of graphs exported as excel files.